Documentation Index

Fetch the complete documentation index at: https://documentation.encodify.com/llms.txt

Use this file to discover all available pages before exploring further.

Data Models

Prev Next

Site Data Model


Location: Home Page → Side Navigation Panel → Modules  → Manage Modules  → Data Model

Site Data Model View


Site Data Model provides an overview of existing modules and the relationship between them.

For each module in the multi-select box, the graph shows all modules that are connected to the given module. If the source and target module have multiple links, they are split by a pipe ( | ) and combined in a single edge.

A complex data model graph illustrating various interconnected elements and relationships.

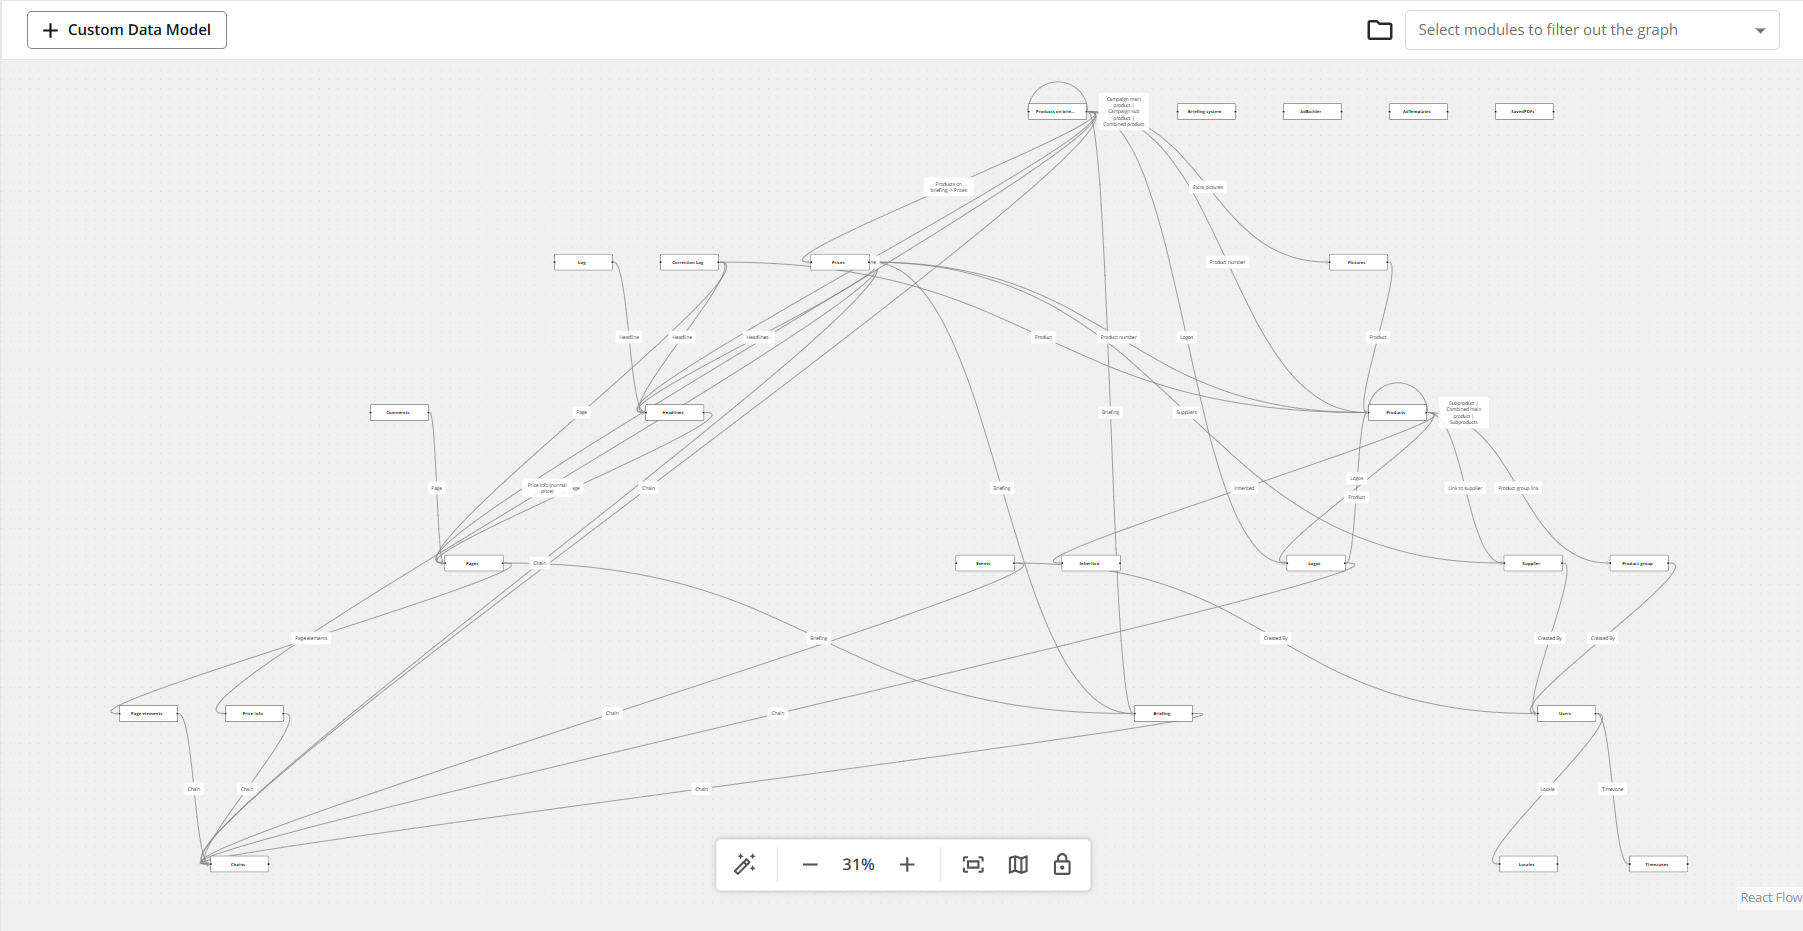
Fig.1.: Site Data Model default view ( no filters applied )

Terminology

Term:

Definition:

Vertex or vertices

Module or modules in the graph

Edge

A line connecting 2 modules displaying their relationship, in other words, module links connecting 2 modules.

Pipe

Used inside the edge to separate multiple links ( | )

Understanding the View

The table below provides a quick overview of the Data Model.

Action

Visual Guide

  1. The Custom Data Model button leads to a list of current Custom Data Models available on the site, allowing users to Edit, Delete, or Create new models.

  1. The Filtering tool enables users to limit the display to only chosen modules and their connections.

  1. Auto Layout to automatically arrange workflow elements for a clear and organised display

  1. Zoom controls allow the ability to zoom in and zoom out

  1. Fit to Page to adjust the workflow view to fit within the available screen space

  1. Show Flow Map provides a visual representation of the entire workflow, enhancing navigation and clarity.

  1. Lock Flow prevents any accidental modifications by locking the workflow structure in place

  1. The Vertices (modules) can be repositioned by clicking and dragging them with the mouse. This enables the user to arrange the modules in the preferred visual layout. The edges automatically adjust when a vertex is relocated. The default positions will be restored when opening the Site Data Model the next time.

  1. The Edge between two vertices can be chosen with a mouse click. This enables the user to more effectively visualise any specific connection when several connections are present.

Logic and Rules


  • Some vertices cannot be connected (if there is no link between vertices)

  • The data model will display only active modules

  • Available only to users with system admin or site admin access

  • Module names and field definitions respect current user language

Known limitations:

  • Edges overlap for cases when module has multiple module links